operate
In-App Debug Copilot
A debug assistant inside your dashboard that already has your project's context.
What you get
Context it already has
The copilot lives inside your dashboard with your project's context already loaded — you don't paste logs or explain your setup before it can help.
Ask what broke
Ask it what went wrong and it knows where to look — deploys, scans, build logs and posture are all context it already holds.
Your deploy, without pasting anything
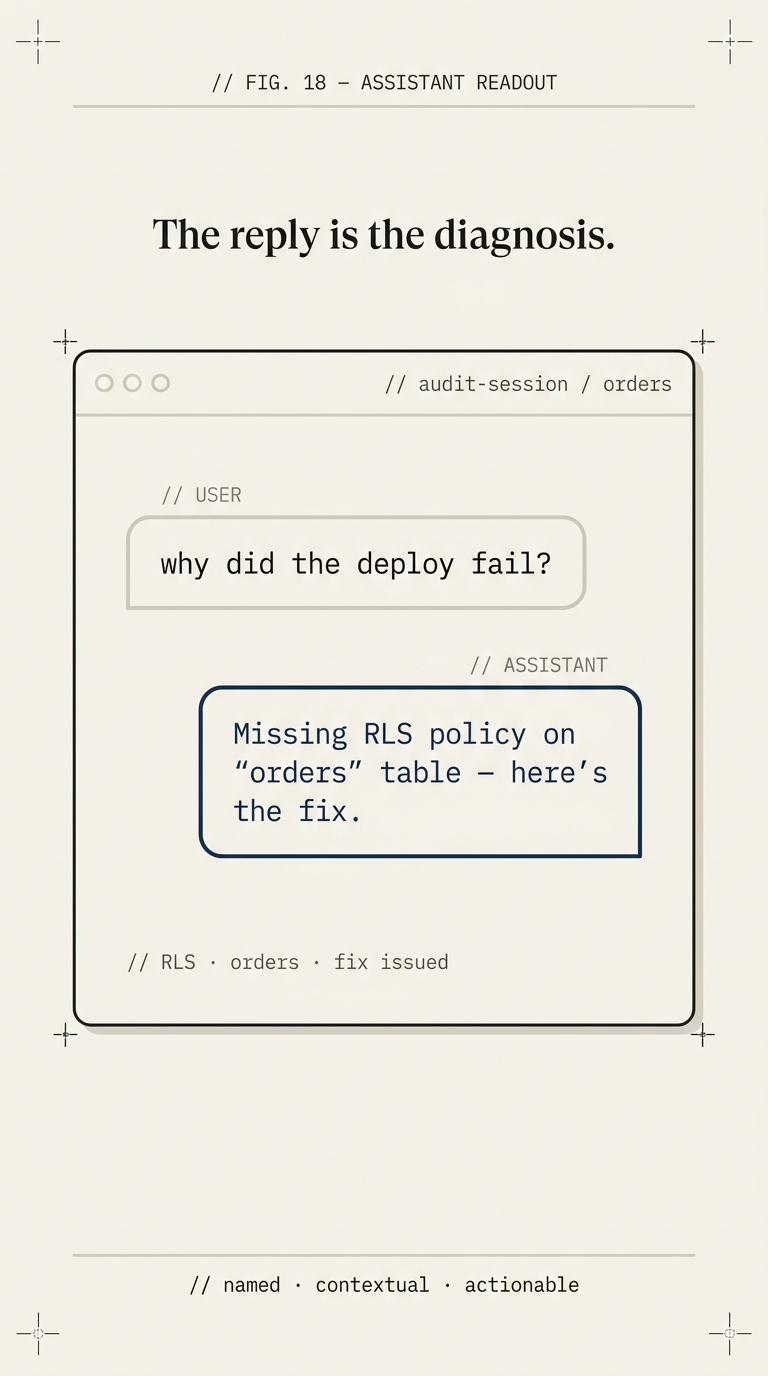
The copilot already sees your build output, detected stack, and recent deploy history — so you ask 'why did this fail' without copying logs into a separate chat and hand-stripping anything sensitive first.
How the copilot works
- 1
Open the debug copilot in your dashboard.
- 2
It already has the context of your project, deploys and findings.
- 3
Ask what broke and it points you to the cause.
What this check inspects
Your build output and deploy history for the project you're asking about.
The detected framework and runtime, so advice matches your actual stack.
Recent scan findings, so a security cause isn't missed when you're debugging a symptom.
What changed between the working release and the broken one.
What it means when this fails
The usual debugging loop is copy logs, paste into a chat, redact secrets, explain the stack, repeat. The copilot starts with that context, which removes both the busywork and the risk of pasting a key into someone else's tool.
Questions
- Is my code sent anywhere?
- It works within your ZipLoom project context. Don't paste anything into any assistant you wouldn't want stored — that advice applies everywhere, including here.
- Can it change my code?
- It explains and suggests. Changes are yours to make.
- How is this different from Build Doctor?
- Build Doctor diagnoses a specific failed build automatically. The copilot is conversational — for when you want to ask why something behaves the way it does.
Related features